lunes, 30 de junio de 2008
martes, 24 de junio de 2008
lunes, 23 de junio de 2008
Movimiento ingeniado?... o ingenioso...
Uno de los grandes peligros que acechan a los traders de cualquier mercado (divisas, acciones, futuros, etc), son los movimientos ingeniados (Engineered movements).
Estos movimientos, son "orquestados" por los grandes operadores (léase Bancos Centrales, Empresas multinacionales, Bancos, etc.) y no buscan nada diferente que empujar los mercados a ciertos niveles que beneficien sus posiciones. Normalmente esos movimientos se hacen cuando esos grandes actores (insiders) están en posiciones contraproducentes para ellos.
Pero, ¿por que tales movimientos son peligrosos para los traders (me refiero a los pequeños mortales que buscamos montarnos en las tendencias del mercado) ?
Por la sencilla razón de que dichos movimientos son "artificiales", y si no se conoce su existencia, pueden resultar catastróficos.
¿En que consisten? ... pongamos un ejemplo:
Si una persona del común hubiera quedado "enhuesada" con una buena cantidad de dólares en una caída como la que se ha venido dando en Colombia en los últimos meses, esa persona hubiera podido hacer dos cosas: vender los dólares lo mas rápido posible para evitar perder mas dinero, o esperar a que las cosas vuelvan a su cauce y vender cuando el precio le permita, por lo menos, salir de los dólares sin perder dinero.
Si ese mismo escenario se hubiera presentado con un gran operador, con capacidad suficiente para mover los mercados, este hubiera podido "orquestar" un movimiento que hiciera que los precios se devolvieran para lograr salir de los dólares caros. Como? comprando dólares baratos recurrentemente, de forma que se cree una pequeña ola alcista. Una vez los precios lleguen al nivel buscado, se vendes los dólares caros (quedando en equilibrio) y los dólares baratos, ganándose la diferencia de precios.
¿Y que creen ustedes que pasaría en ese momento?....caída libre de nuevo. Los precios volverían a buscar su tendencia y la caída seria retomada; a menos que la nueva ola alcista creada tenga suficiente fuerza para continuar sin la ayuda de los "insiders".
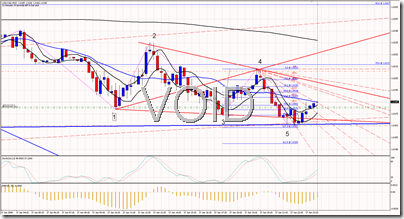
La situación actual en el par Dólar/Peso, específicamente el anuncio del Banco de la República de intervenir el mercado comprando USD 20 millones diarios, no es mas que un movimiento ingeniado, en este caso, para ayudar a estabilizar el mercado Colombiano.
Los efectos se han empezado a ver hoy, inclusive sin que el Banco de la República haya efectuado la primera compra.
La pregunta es, ¿hasta cuando seguirá el Banco de la República con dicha política de compra?... por supuesto eso no puede durar para siempre.
Pienso que cuando llegue el momento de suspender la intervención del mercado, el precio del dólar volverá a caer.
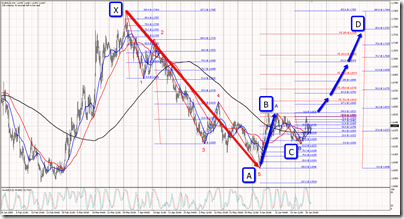
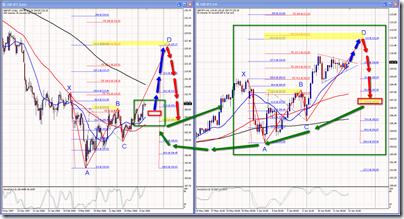
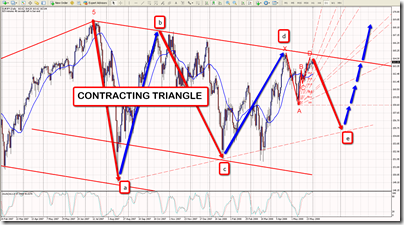
Siendo coherente con mi proyección de semanas pasadas, proyecto que la divisa subirá de precio, encontrando resistencias en los niveles de 1.745, 1.813, 1.921 y 1.999/2.000.
Los puntos críticos para una posible reversa serán 1.813 y 1.921 y 2.000.
Los exportadores a recuperarse todo lo que puedan, pero sobre todo, a pensar en herramientas financieras que les permitan compensar un peso revaluado, que cada vez será mas común.
martes, 17 de junio de 2008
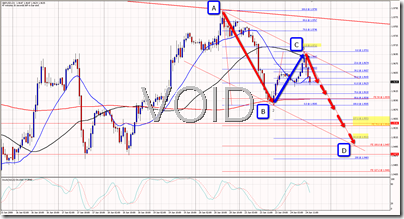
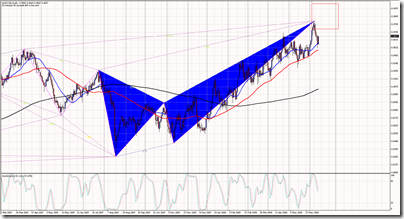
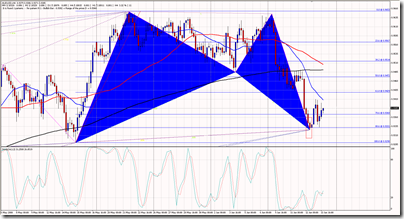
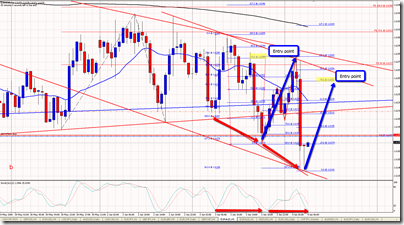
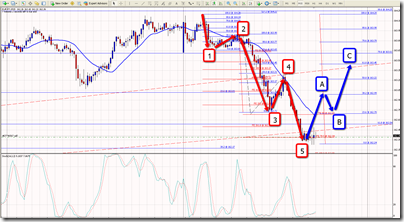
USDCAD Bullish Wolve Wave_ M15
This could be a temporary retracement.
Main bias still to the downside.
Demo account statement publishing... doubled edge sword (for better trading).
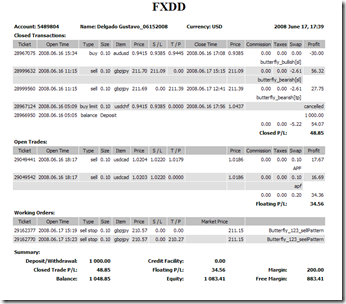
UPDATE
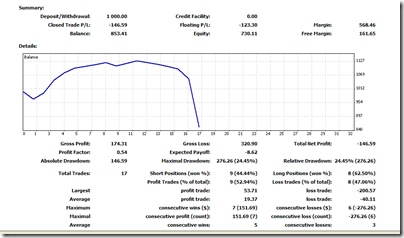
Ok... not a good week for my initial goal, since i have negative numbers with 3 trades opened when the weekend arrived.
Even though i think that actual numbers are "temporary floating numbers", since my forecasts are that all 3 trades in NZDUSD (long) ,GBPJPY (short) and USDCAD (short) take the proffitable way on next week.
What i think now is to change a bit the initial contest, in the way of better to meassure how much time i spend in the process of converting the initial USD 1K into 2K, with the goal of do it in 1 single week.
Another think which i am having some problem is that i can not generate a readable bitmap, because of the number of trades is too high.
I shoul buy an FTP service in order to fix that. In the meanwhile, here is the summary.
ORIGINAL POST
Is not common to find traders that use to publish their account statements. For obvious reasons people avoid to do so.
I think that publishing setups is an important edge, because makes the trader to "think twice" about what he is going to do. So publiching account statements makes that edge double.
From now, i am going to open demo accounts each new week, begening with USD 1000. The idea is to measure the performance during the week, in order master the reach the goal of convert those 1k into 2k in one (1) sigle week.
So i will be posting not only my setups, but my demo account statement.
This is the first post for the actual week. I will publish every day at the begening of the New York session.
lunes, 16 de junio de 2008
Setups of the Week... for monitoring
AUDCAD_CRAB_D1
AUDUSD_BAT_H4
EURJPY_BUTTERFLY_D1
GBPCHF_D1
NZDUSD_BAT_D1
jueves, 12 de junio de 2008
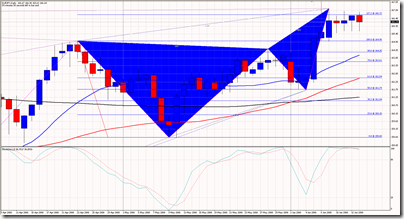
GBPJPY Nested Butterfly
Interesting forecast. Lets se what happens.
IMPORTANT NOTE:
After i made the drawings, my friend Paulo Banha made me realize that master Butterfly's point B act as a "not goes beyond" level for the smaller Butterfly trade. So the target of this last trade should be the 50% retracement of the H4 butterfly`s AD segment which is at 207.95, almost the same level of the master buterfly`s B point wich is at 208.99.
miércoles, 11 de junio de 2008
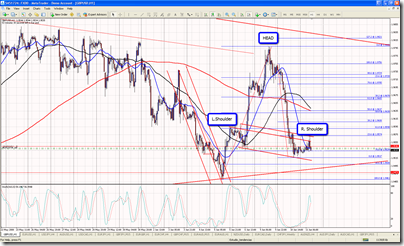
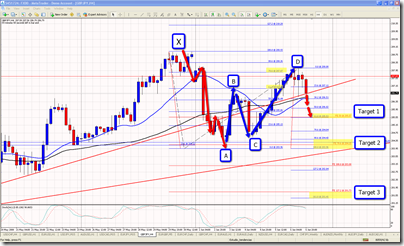
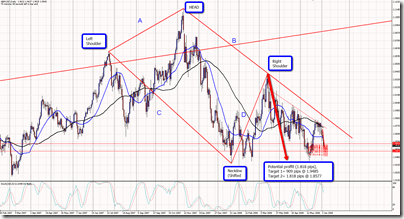
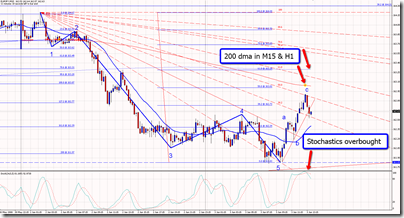
GBPUSD Head & Shoulders H1
Head & Shoulder`s body have to be below the pattern. Trivial error.
Thanks a lot Paulo.
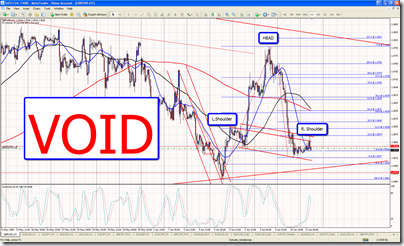
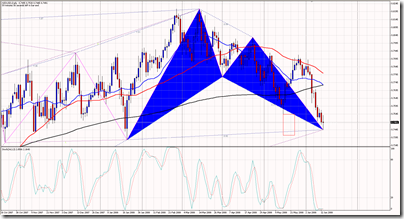
This one is coherent with the Bearish Diamond formation spoted some days ago.
Related posts: http://gustavoforex.blogspot.com/2008/06/gbpusd-bearish-diamond-formation.html
martes, 10 de junio de 2008
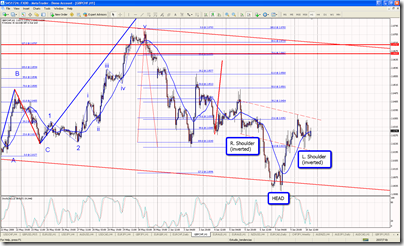
GBPCHF 1 hour Bullish inverted Head & Shoulders
This one could confirm the bullish channel within a bigger bearish one.
miércoles, 4 de junio de 2008
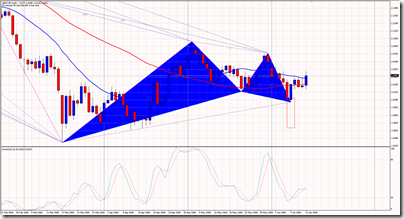
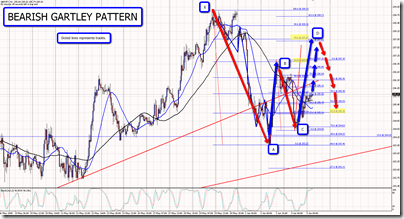
GBPJPY Gartley
UPDATE (Jun/09/16:49)
First Target hit. Not bad at all.
UPDATE (Jun/06/18:51)
Leg CD unfolded as expected.
Now lets short the pattern.
Videocast available @ http://www.screencast.com/t/qlRKyXNaNU
ORIGINAL POST
Thanks for the help to spot it John.
A little late, but i think there is still place for some pips trading CD leg.
When completed, the "short" side of the pattern becomes in action.
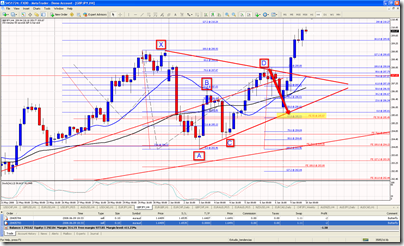
GBPUSD Bearish Diamond formation
This is my first work in Diamond formations, since i recently learned to spot this one. Thanks for that Paulo.
First target is already reached.
lunes, 2 de junio de 2008
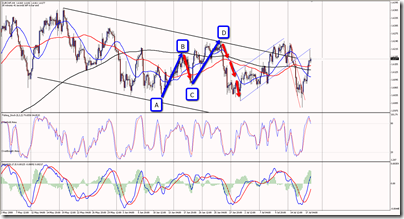
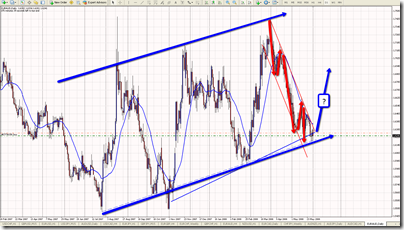
EURAUD Bullish overview - going well
UPDATE (Jun/10/11:55)
Ok, nice trade. Target almost reached. stopped twice but because a tight stop. Reenter and things went all right.
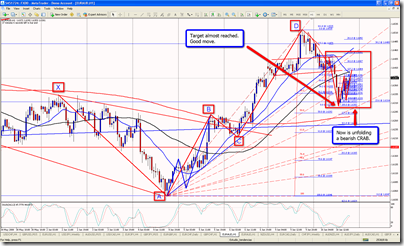
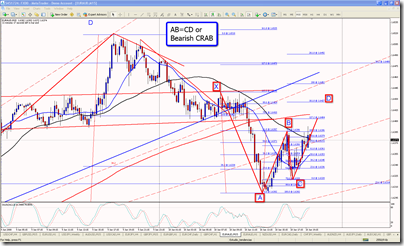
Now, in the red rectangle, pair is possible unfolding an AB=CD pattern, or maybe a Bearish CRAB.
UPDATE (Jun/09/16:40)
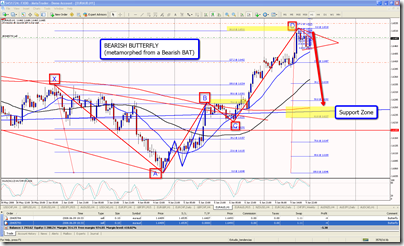
BAT metamorphed to a butterfly?
UPDATE (Jun/06/06:22)
UPDATE (Jun/06/2008/15:40)
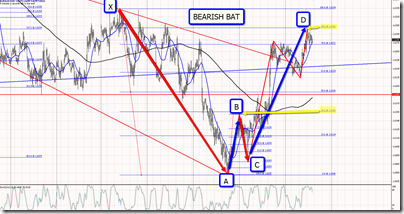
Within the bullish outlook, this is a bearish BAT.
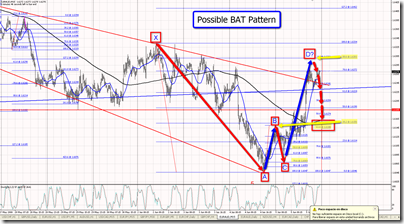
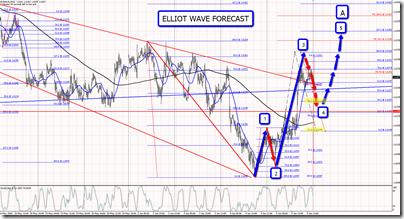
In the next pic I`ll try to link this BAT pattern to the EW forecast.
Dont forget we are in a ABC correction.
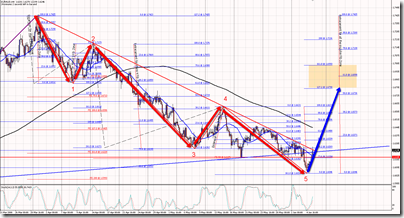
UPDATE (Jun/06/2008)
Well, that 5th wave was a pain...
This is my new count, which can be the begening of a new harmonic pattern. Initiallly looking for a Gartley, so expected target will be 61.8 level @ 1.6898, beautiful number.
UPDATE
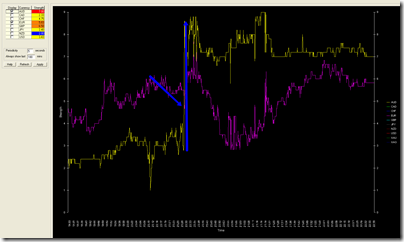
2 Divergences. The first one didn`t work because it did not give us an entry.
The long red candlle was the GDP announcement in Australia. I didn`t see it coming. Anyway, i think the gap will be filled. Take a look of the meter in the news announcemet.
Original Post
This is another point of view of the bullishness of the pair. Easily we could be 6 months from here in the upsidie movement.
for more info about this pair go to:
http://gustavoforex.blogspot.com/2008/05/euraud-bullish-retracement.html
http://www.pipomatic.com/forum/aud-pairs/euraud-time-to-be-bullish/page-1/post-21/#p21
EURJPY bearish outllok
UPDATE (Jun/03/05:54)
UPDATE
A bullish retracement inside the bearish movement.
This divergnce, also confirmed in M30 & M15, reinforeces such a retracement.
ORIGINAL POST
Looking at the Monthly time frame, we can se that the pair is clearly retracing form the last down movement.
That ratracement is by now around the 38.2 level, which could be the point "B" of a possible "BAT" pattern.
Elliott Wave count give us a 5 wave movement to the upside, which can be the wave "A" of an "ABC" corrective pattern, so one can expect the price to go down now, unfoldong the correction of the actual 5 waves movement.
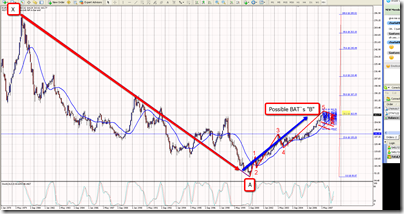
In the Weekly time frame, we can see that the retracement for the 5 waves impulsive movement to the upside, bearly went a little below the 23.6 fib level, which is not a common level to find support, so we can expect the price to continue going down looking for the 38.2 .
There is an important triangle that seems to be is being repected, meaning that even though price is retracing, it will not necessary do down to 38.2 level, so, for now, i will trade just the triangle, having as target the lower edge of it.
Additionally to the triangle, i see a bearish BAT. This one i will trade with an entry at the break of the 38.2 fibfan level in the H4 time frame.
2 Targets. 1st. one, as my Money Management, 30 pips. The 2nd, as a free trade, looking for the lower edge of the triange, moving SL every 30 pips gained.
This is another point of view...
Suscribirse a:
Entradas (Atom)